Candidate Compare: Generate Compare Candidate Analysis
The Compare Candidates feature can provide a deeper comparison between a selection of candidates within the requisition. From either the Candidate List Panel or the requisition folder, recruiters can select up to eight candidates to generate a more thorough analysis between candidates.
To generate a compare candidate analysis do one of the following:
- Requisition folder: Select multiple candidates within the folder, right-click, and then select Compare Candidate from the shortcut menu.
- Candidate List panel: Expand a requisition folder to display the Candidate List panel. Select up to eight candidates from the list and then select Actions > Compare Candidates.
After the specific candidates are selected for comparison, the Candidate Resume to Job Description Correlation window appears and shows a deeper analysis of candidate resumes in comparison with the job description.
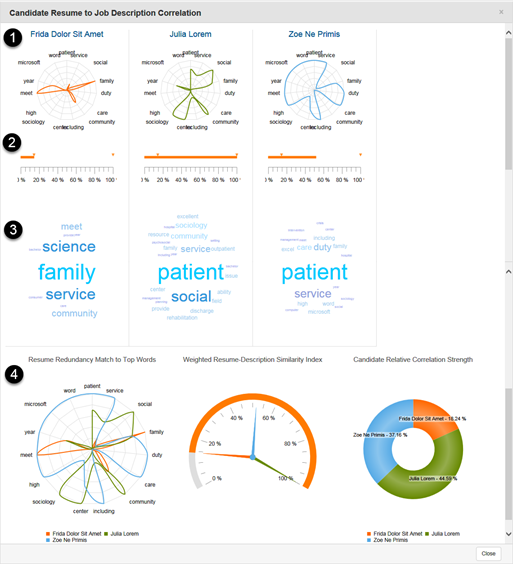
Figure: Candidate Resume to Job Description Correlation
Table: Candidate Resume to Job Description Correlation Page Element Descriptions
Ref Number |
Description |
1 |
The radius map chart shows a correlation between the words used the most between the candidate resume and the job description. This radius map chart displays how certain words are used by the different candidates and how relevant those words are compared to the job description. |
2 |
The linear chart displays the relationship between the each candidates' scores. The arrow on the far right represents the top score and the left arrow represents the lowest score between all the candidates selected. The orange bar represents the score of the individual candidate. |
3 |
This area of the chart displays a word cloud analysis of the most relevant words in the resume. The largest the word means that it has more weight presentation on the resume compared with smaller words that are relevant but not as much as the largest word. |
4 |
This area contains three separate graphs:
|
Additional Information